Noise properties and unpleasantness
Thanks to the 14 people who participated in the little psychoacoustic experiment published last week! The experiment is finished and we will present you the results in this article.
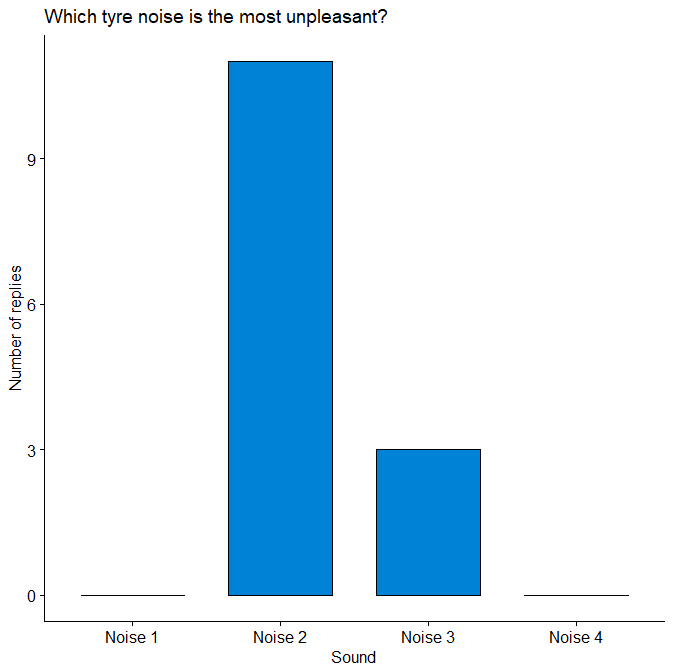
In the graph below, we can see that a particular noise has been chosen by the majority of the participants:

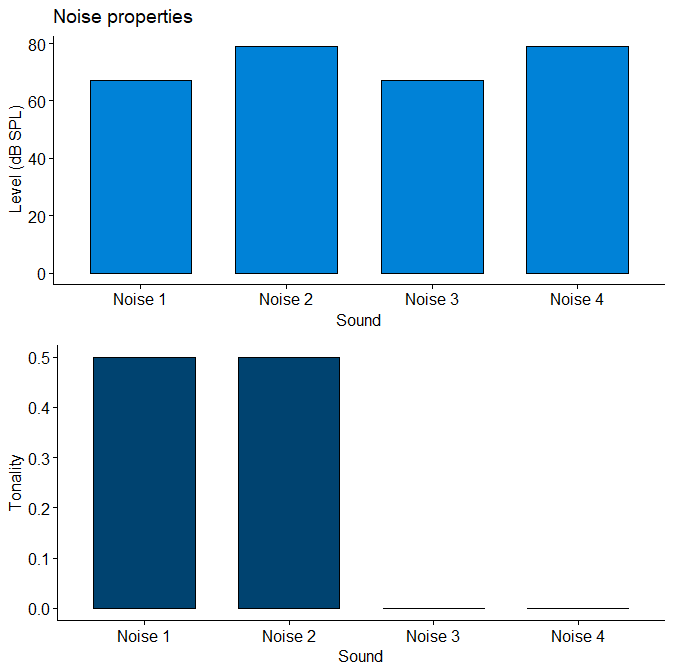
When we look at the different acoustic properties of these noises, we see that the most unpleasant noise is the one with the highest level (79 dB SPL) and the highest tonality (0.5):
The tonality and the level are among the psychoacoustic characteristics that were used by participants during our free sorting task to separate tyre sounds into different categories. They are also the two parameters that most influenced the participants’ annoyance when self-evaluating the unpleasantness of tyre noises during our recent experiment.
But what do these acoustic parameters represent and why do they have such an influence on the annoyance felt by the participants?
The sound pressure level (SPL) of a sound is – basically – a measure of how loud a sound is. Given that people might have different hearing sensitivities, the same sound pressure level might be perceived differently by people. To avoid this variability, an objective measure of the SPL of a sound is calculated in décibels (dB) as:
20 x log10 ( RMS(sound) / Pref)
with RMS, the root mean square of the acoustic pressure of a sound and Pref, the reference acoustic pressure in the air, i.e 2 x 10⁻⁵ N/m². Several studies (for example [1]) reported that the SPL is an important factor that explains the discomfort: the louder the sound, the higher the level and the more annoying the noise.
The tonality quantifies the emergence of tones in noises. For example, a sound composed only of white noise is very diffuse, whereas a pure tone, composed of a single frequency will have a very high tonality. Like the level, noise with a high tonality tends to attract attention and be more disturbing . As an example, the spectrogram bellow was calculated from Noise2 (highest level and tonality). You can see that there are precise frequencies (one is highlighted by a black rectangle) emerging from the rest of the noise.

Spectrogram of Noise 2: A spectrogram is a representation of the evolution of the frequencies according to time. Low-pitch sounds will have lower frequencies, high pitch sounds will have higher frequencies. The level of each frequency is represented by a color, the louder a frequency
If you want to play with those two parameters and see how it affects the sounds, you can play with the interactive below (also available by following this link: https://leontmc.shinyapps.io/interactivespectro/). There, you can set the level and the tonality of a sound that is composed of a white noise and a pure tone with a frequency of 440 Hz. The level slider will set the global level of a sound. The tonality slider will serve as a mixing ratio between the white noise and pure tone. The spectrogram and oscillograph below those sliders will automatically update and you can hear the resulting sound when clicking on the button. Currently, the button is not working in Firefox but it works in Google Chrome, Microsoft Edge and Opera. The rest of the features of the interface works independtly of the web browser.
[1] Jakovljevic, B., Paunovic, K., & Belojevic, G. (2009). Road-traffic noise and factors influencing noise annoyance in an urban population. Environment international, 35(3), 552-556.
[2] Brocolini, L., & Parizet, E. (2015, August). Influence of tonal components on the unpleasantness of airplane noise at take-off. In Inter-Noise and Noise-Con Congress and Conference Proceedings (Vol. 250, No. 2, pp. 4390-4396). Institute of Noise Control Engineering.
